Monstercat × Artist Influence
Campaign Performance Report
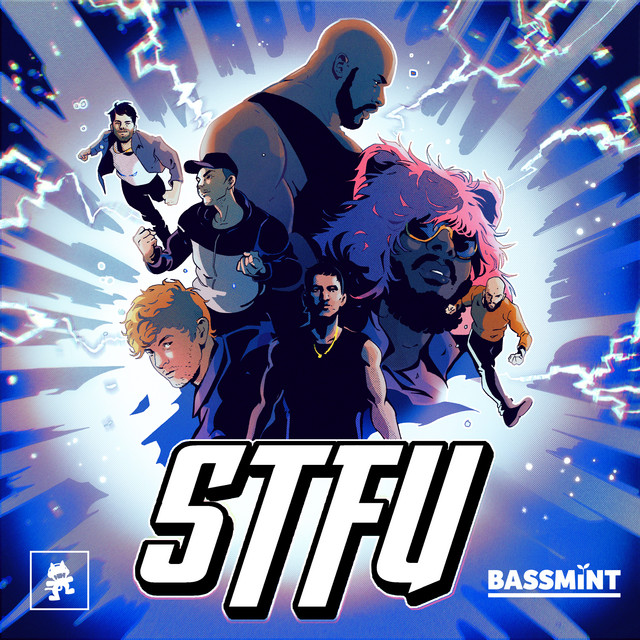
STFU cover art

STFU

T-Pain · DJ DIESEL · NGHTMRE · San Holo · Kompany · SampliFire · IVORY

Released Jun 26, 2026 Reporting through Aug 10, 2026 Meta flight complete Spotify + SoundCloud in flight
972,694
Spotify streams
3,295,127
Creator views
42M
SoundCloud reach
17.64%
Meta click rate
$0.0050
Ad cost per stream
01 · Scope and investment

What we planned, what we placed

Five channels ran against STFU: Meta ads driving to Spotify, Tier 1 Spotify playlisting, SoundCloud repost waves, a custom bass creator program, and rap-vertical Instagram seeding. Every line below is tracked to a live source.

Channel
Planned
Delivered to date
Status
Meta AdsTraffic to Spotify
$2,800 to $5,000
media + $600 mgmt + $200 setup
$4,823.37 media placed · 138,954 link clicks · 608,459 reached · 17.64% CTR
Complete
Spotify PlaylistingTier 1 · 100K streams
$2,100
49,608 streams driven across 10 lists · 3,174,987 combined follower reach · 1.1K/day and accelerating
In flight
SoundCloud RepostsRepost network
$1,300
42M follower reach across two scheduled waves · 6/26 and 7/20
Delivered
Custom CreatorsBass vertical
$5,000
47 posts · 2,451,806 views · 131,975 engagements · 5.38% engagement rate
Complete
Rap IG SeedingRap and EDM pages
$4,000
20 posts · 843,321 views · 57,784 engagements · 6.85% engagement rate
Complete
Total program
$15,200 to $17,400
3,295,127 creator views, 972,694 Spotify streams, 42M repost reach, 608,459 paid reach

The IG Seeding and Custom Creators lines were quoted together at $6,500 to $9,000 combined. They are broken out here at their booked amounts, $5,000 for bass creators and $4,000 for rap seeding, which lands at the top of that range.

02 · Meta Ads

The highest converting flight on our entire roster

A five week traffic campaign pointed at Spotify, run in two phases: a warmup set that proved the creative and the audience, then an optimized scale phase on that same proven set. It finished 100% delivered on Aug 3.

Budget pacing · Meta · Jun 27 to Aug 3, 2026
$4,823.37
$4,823.37 OF $4,823.37 · 100% DELIVERED
Warmup · Jun 27Phase switch · Jul 21Complete · Aug 3
Link clicks
138,954
162,828 total clicks including all placements
People reached
608,459
All US delivery, banked and retargetable
Landing page views
~130,000
At about $0.04 each
Cost per click
$0.030
Blended across the full flight
Click-through rate Exceptional
17.64%
~18x the ~1% music industry average, sustained across five weeks
Cost per click Exceptional
$0.030
15x below the $0.45 Spotify-traffic benchmark
Cost per landing page view Exceptional
$0.04
13x below the $0.50 category benchmark
Link clicks to date

Cumulative results, compounding day over day

▲ Biggest day
6,910
Link clicks · Jul 17
▲ Peak click rate
19.80%
Single day · Jul 2
▲ Cheapest day
$0.02
Per click · Jul 1
Spotify streams vs ad clicks

Daily streams over ad link clicks

Spotify streamsAd link clicks
Daily spend

Meta placement by day, holding a $170 to $186 band through the scale phase

Spend by day
Efficiency over time

Click rate and cost per click by day

CTR %CPC $
Launch-day delivery by hour

Spend and link clicks by hour of day

SpendLink clicks
Warmup reach by state · US delivery · live Meta pull Jul 15

14 markets, 183,002 reach

Top marketsBuildingRamping
YouTube views · music video

Cumulative music-video views, still climbing after the flight closed

Unit economics · this campaign ran profitably

The flight sits at the line most music campaigns never reach: the ads roughly pay for themselves in streaming royalties alone. Total ad spend works out to about $0.0050 per stream. Because this campaign ran all-US traffic, which is the highest-payout streaming market and premium-subscriber heavy, each US stream returns in the neighborhood of $0.004 to $0.005 in recorded-music royalties.

Ad cost per stream sits right at the payout band, so every dollar in comes back in royalties before counting what the campaign is really buying: roughly 130,000 landing page views banked into the pixel, streams feeding the algorithm, and the saves and follows that keep paying after the ads stop. Deliberately targeting only the expensive but highest-value US audience is what makes the unit economics close. A cheap-reach international flight would show prettier click costs and worse economics.

Ad cost / stream
$0.0050
All-US delivery
US payout / stream
~$0.004 to $0.005
Industry estimate, premium heavy
Royalty ROI
~Breakeven
Before saves, follows and halo

Royalty figures are standard US per-stream estimates. The label's statements are the final word.

03 · Spotify playlisting

Tier 1, heavy bass lists only

A $2,100 Tier 1 placement against a 100,000 stream target. The brief led with dubstep and heavy bass, and the delivered set pairs those core lists with high-volume workout and rap lists where the record's energy carries. Placements are live and the daily rate is speeding up.

Streams driven
49,608
Of the 100,000 stream target
Past 7 days
10,700
Roughly 1,529 per day average
Current daily
1,100
Dailies accelerating week over week
Combined follower reach
3,174,987
Total followers across the 10 placed lists
Delivery progress
49,608 of 100,000
49.6% DELIVERED
Placed Jul 6Today · Aug 10Target
Streams driven and projected delivery

At the current pace the target lands around Sep 20

DeliveredProjected

Projection assumes the current 1.1K per day rate continuing and easing up toward 1.5K as placements mature. Delivered figures through Aug 10 are exact.

The 10 lists

Total follower reach 3,174,987
04 · SoundCloud reposts

Two repost waves, 42M follower reach

A $1,300 repost campaign scheduled in two waves: one on release day to carry the launch, one on Jul 20 to re-light the record mid-cycle. SoundCloud repost networks sell reach and placement in feeds, not streams.

Wave 01Jun 26

Release day

Scheduled to land with the Monstercat release so the record hit the bass feeds the same day it went live.

21M
View schedule ↗
Wave 02Jul 20

Mid-cycle re-light

Timed to the Meta phase switch on Jul 21, so paid scale and organic repost reach hit the same week.

21M
View schedule ↗
Notable reposts

Artists and brands that carried the record

05 · Creator programs

67 posts, 3.3M views, 189K engagements

Two separate creator programs ran in parallel: a custom bass creator program producing original content on TikTok and Instagram, and a rap-vertical Instagram seeding buy placing the record on large aggregator and culture pages.

Total views
3,295,127
Across both programs
Total engagements
189,759
Likes, comments and shares combined
Live posts
67
47 bass creators, 20 seeding placements
Cost per engagement
$0.047
$9,000 combined creator spend
Bass Creators · custom content

2,451,806 views from 47 original posts

31 creator accounts across TikTok and Instagram, briefed to make original content to the drop rather than repost the audio. Engagement rate landed at 5.38%.

Views
2,451,806
24 TikTok, 23 Instagram
Likes
118,241
2,448 comments
Shares
11,286
The metric that signals genuine spread
Engagement rate
5.38%
Strong for a paid creator program
Rap IG Seeding · aggregator pages

843,321 views from 20 placements

Placed on rap and EDM aggregator pages, led by @rap at 553,589 views. Engagement rate landed at 6.85%, higher than the creator program, which is what you expect when the audience is already assembled.

Views
843,321
All Instagram placements
Likes
50,426
835 comments
Shares
6,523
7.7 shares per 1,000 views
Engagement rate
6.85%
Above the bass creator program

A handful of seeding placements report zero views in the tracker because the page has view counts hidden. Their like and comment counts are live and are included in the engagement totals.

06 · Where this leaves the record

The summary

STFU is at 972,694 all-time Spotify streams and the paid flight delivered them at roughly half a cent of ad cost per stream. That is the rate at which a paid streaming push comes close to paying for itself in royalties alone, which is rare enough that we flag it every time it happens.

The Meta flight placed $4,823.37 and delivered roughly 130,000 landing page views at about four cents each, 138,954 link clicks across 608,459 people reached, at a 17.64% click-through rate. That is close to eighteen times what music campaigns typically achieve, sustained across five weeks rather than for a few days at small scale.

The campaign also went out on its best day. Its final day of delivery posted an 18.50% click-through rate, the highest single figure of the entire flight, on the same creative that opened it. The set was still improving when it reached its budget, which is the clearest possible signal that the audience was nowhere near exhausted.

The run was built in two phases. A warmup traffic set proved the creative and the audience first, then on Jul 21 the flight moved into optimized scale on that same proven set and held a $170 to $186 per day band for nine consecutive days at peak. Sequencing it that way is why the scale phase never had to pay for a learning period, and it is the main reason the blended numbers held up as spend multiplied.

The daily stream rate held a 13,000 to 14,000 band through the close, well clear of the 10,805 low earlier in the run, so the record did not fall off when the money stopped. The music video sits at 98,120 YouTube views and is still climbing a week after the flight ended. T-Pain's audience has kept growing since the flight closed: 6,521,545 Spotify followers and 5,525,905 on Instagram, up 125,905 since we first tracked it on Jul 16, with the track holding a Spotify popularity score of 60.

Two channels are still working. Spotify playlisting is at 49,608 of its 100,000 stream target with dailies accelerating, and the SoundCloud repost waves have put the record in front of 42M followers across two scheduled drops.

1

The audience is banked for the next Monstercat release

608,459 reached people and roughly 130,000 landing page visitors are captured and available to retarget. A follow-up release can launch against a proven warm audience rather than building one from scratch.

2

The creative and the phase structure both proved out

The warmup then scale sequence let the scale phase run without paying for a learning period. That structure is directly repeatable on the next record, and the winning creative is identified.

3

The streaming curve is holding without paid support

Daily streams stayed in the 13,000 to 14,000 band through the close. A record still performing on its own after spend stops is the strongest case for a second flight.

4

Spotify and SoundCloud are still delivering

Playlisting is half way to its target with dailies speeding up, projecting completion around Sep 20. No action needed, we are running point on the close-out and will report again when the target lands.